ggplot(mtcars) +
  geom_point(aes(disp, mpg)) +
  annotate('text', x = 200, y = 30, label = 'Sample Text')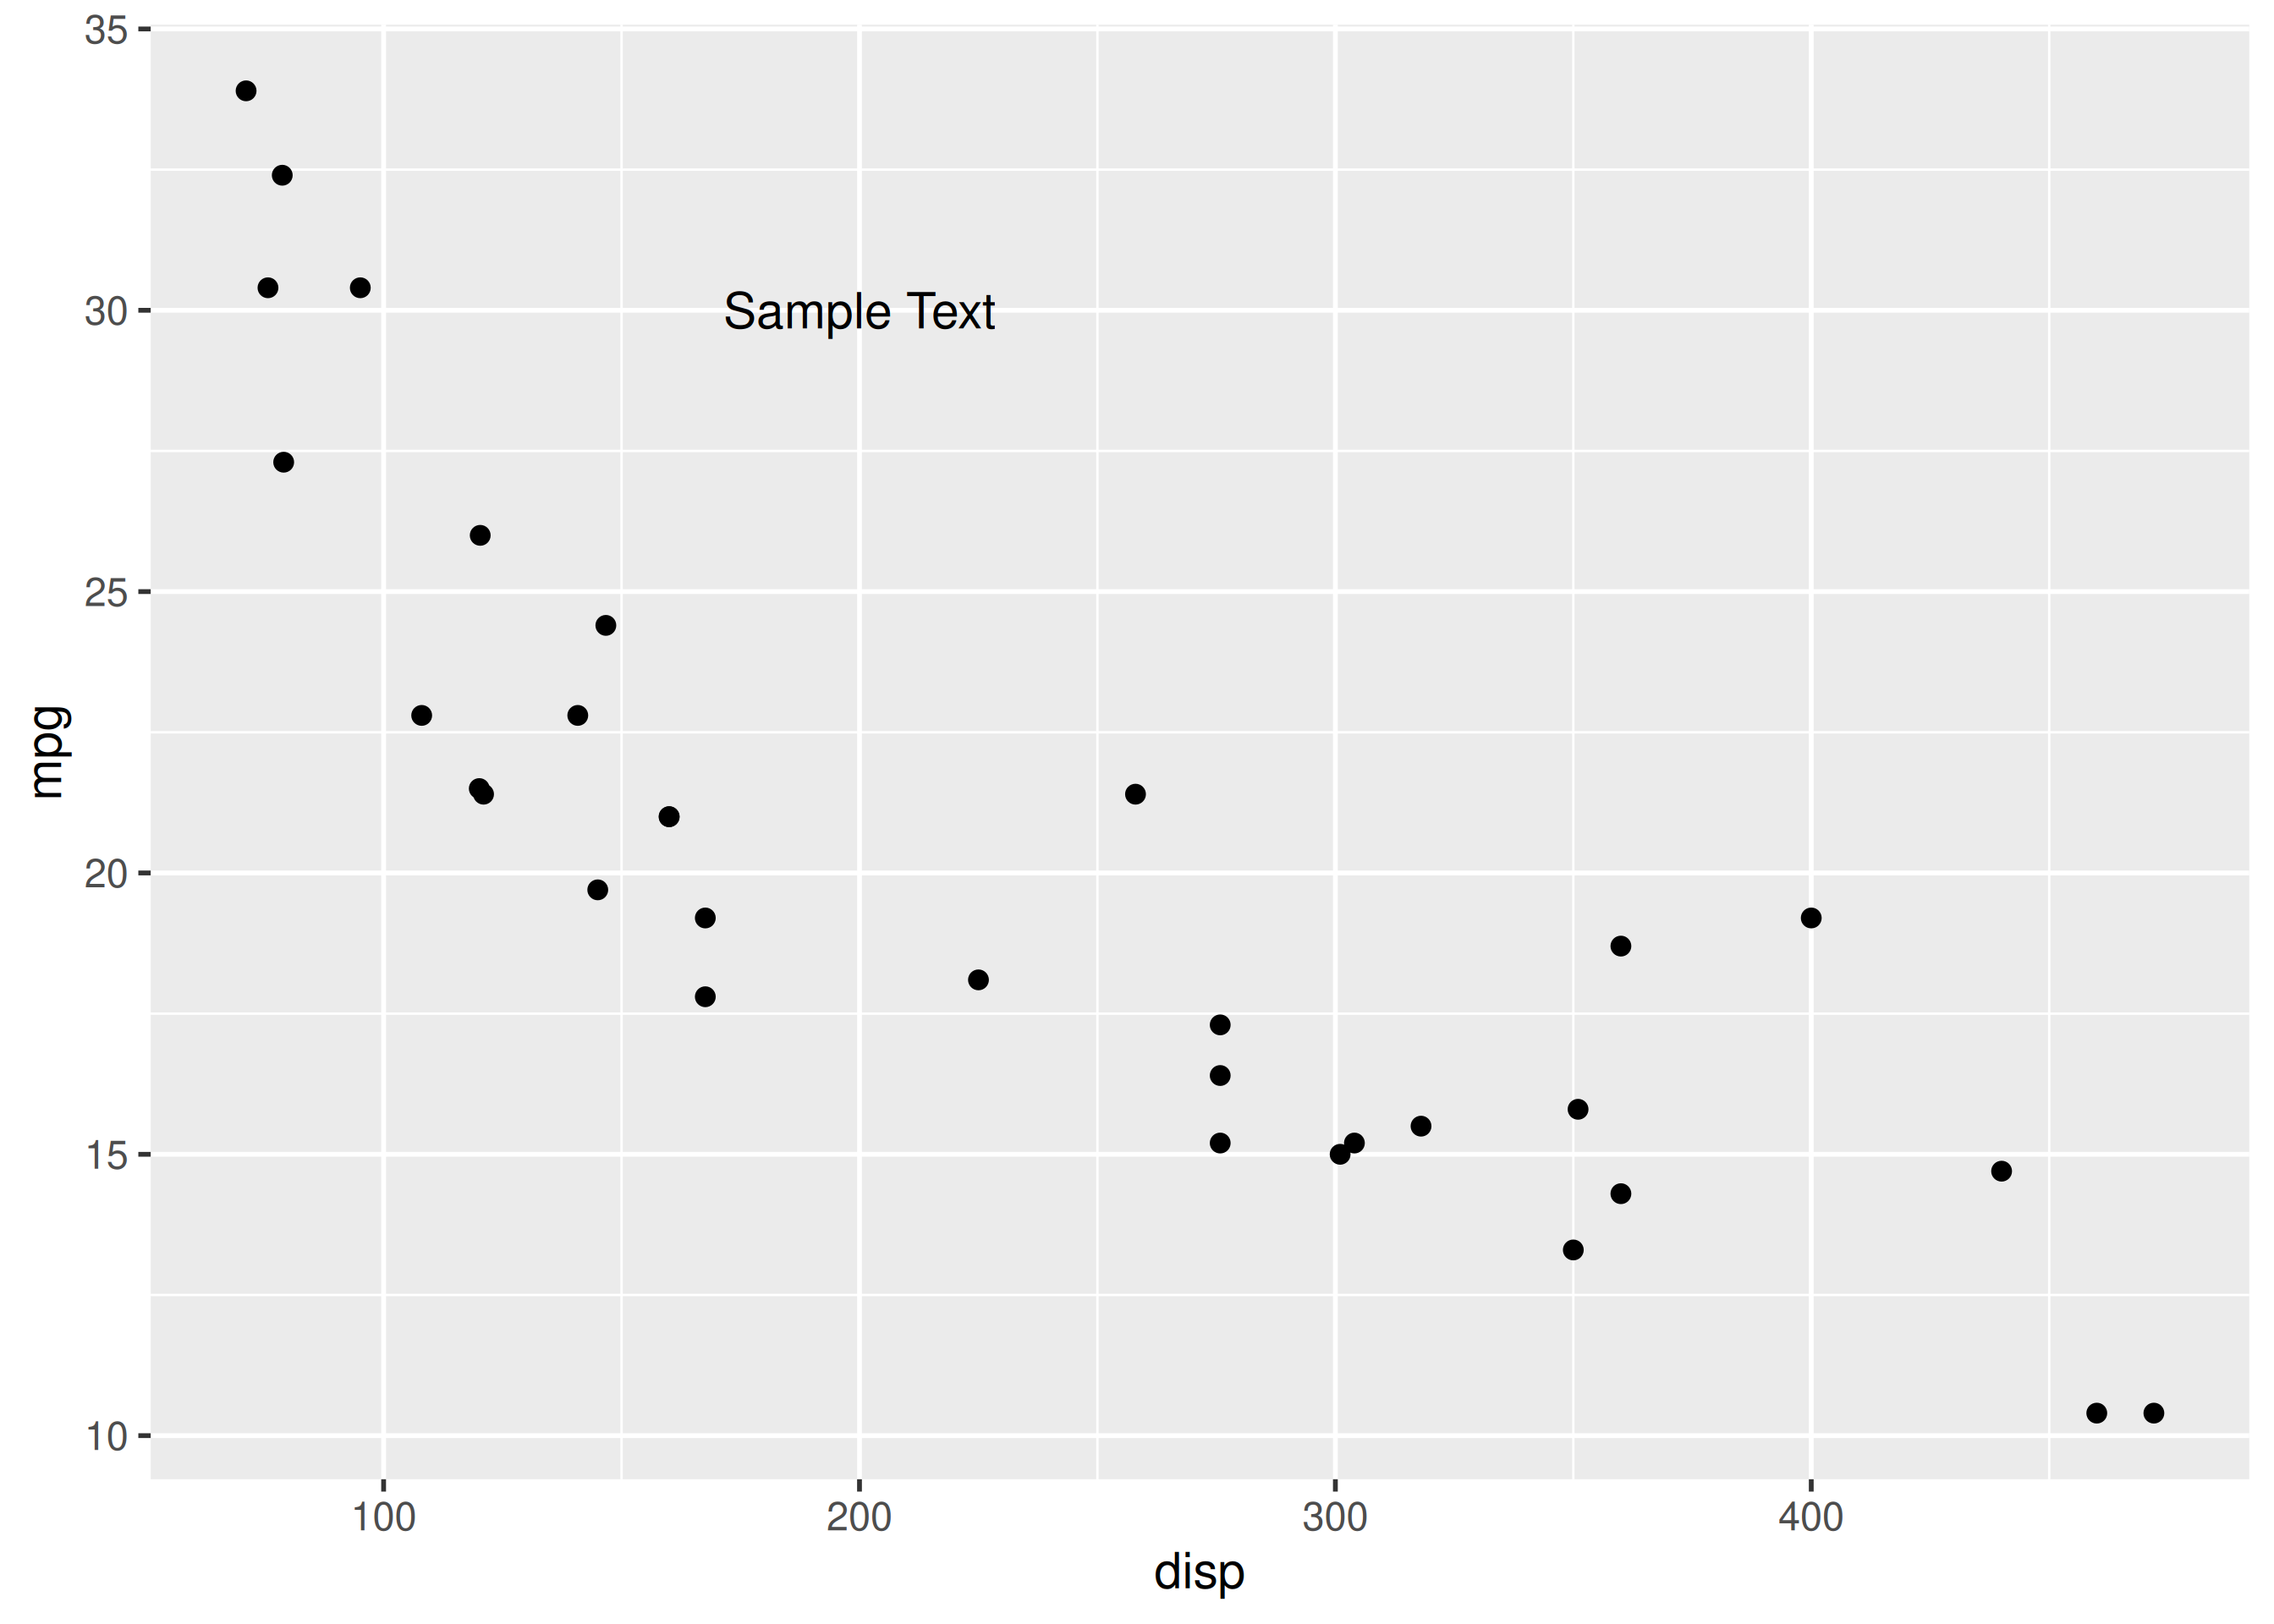
Direct labels and annotations point at the story instead of making readers scan a legend.
Over-annotating every point creates clutter; annotate only the points that change the conclusion.
In this chapter, we will learn to add text to the plots.
We will use the annotate() function to add custom text to the plots. You can use the annotate() function to add rectangles/segments/pointrange as well but our focus will be on adding text. Let us start with a simple scatter plot.
annotate() takes the following arguments:
geom : specify textx : x axis locationy : y axis locationlabel : custom textcolor : color of textsize : size of textfontface : fontface of textangle : angle of textLet us begin by adding text to a scatter plot. We will use the mtcars data set and continue to examine the relationship between displacement and miles per gallon. To add the text, we have to indicate that we are using annotate() for adding text, and we do this by ensuring that the first input is the word 'text'. Now, ggplot2 knows that it should add a text to the plot but it still needs other information such as:
We will provide the location by specifying points on the X and Y axis which are also the second and third inputs to annotate() and the final input is the text itself, which in our example is 'Sample Text'.
ggplot(mtcars) +
geom_point(aes(disp, mpg)) +
annotate('text', x = 200, y = 30, label = 'Sample Text')
Now that we know how to add text, let us look at modifying the appearance of the text. To change the color, use the color argument. In the below example, we modify the color to 'red'.
ggplot(mtcars) +
  geom_point(aes(disp, mpg)) +
  annotate('text', x = 200, y = 30, label = 'Sample Text', color = 'red')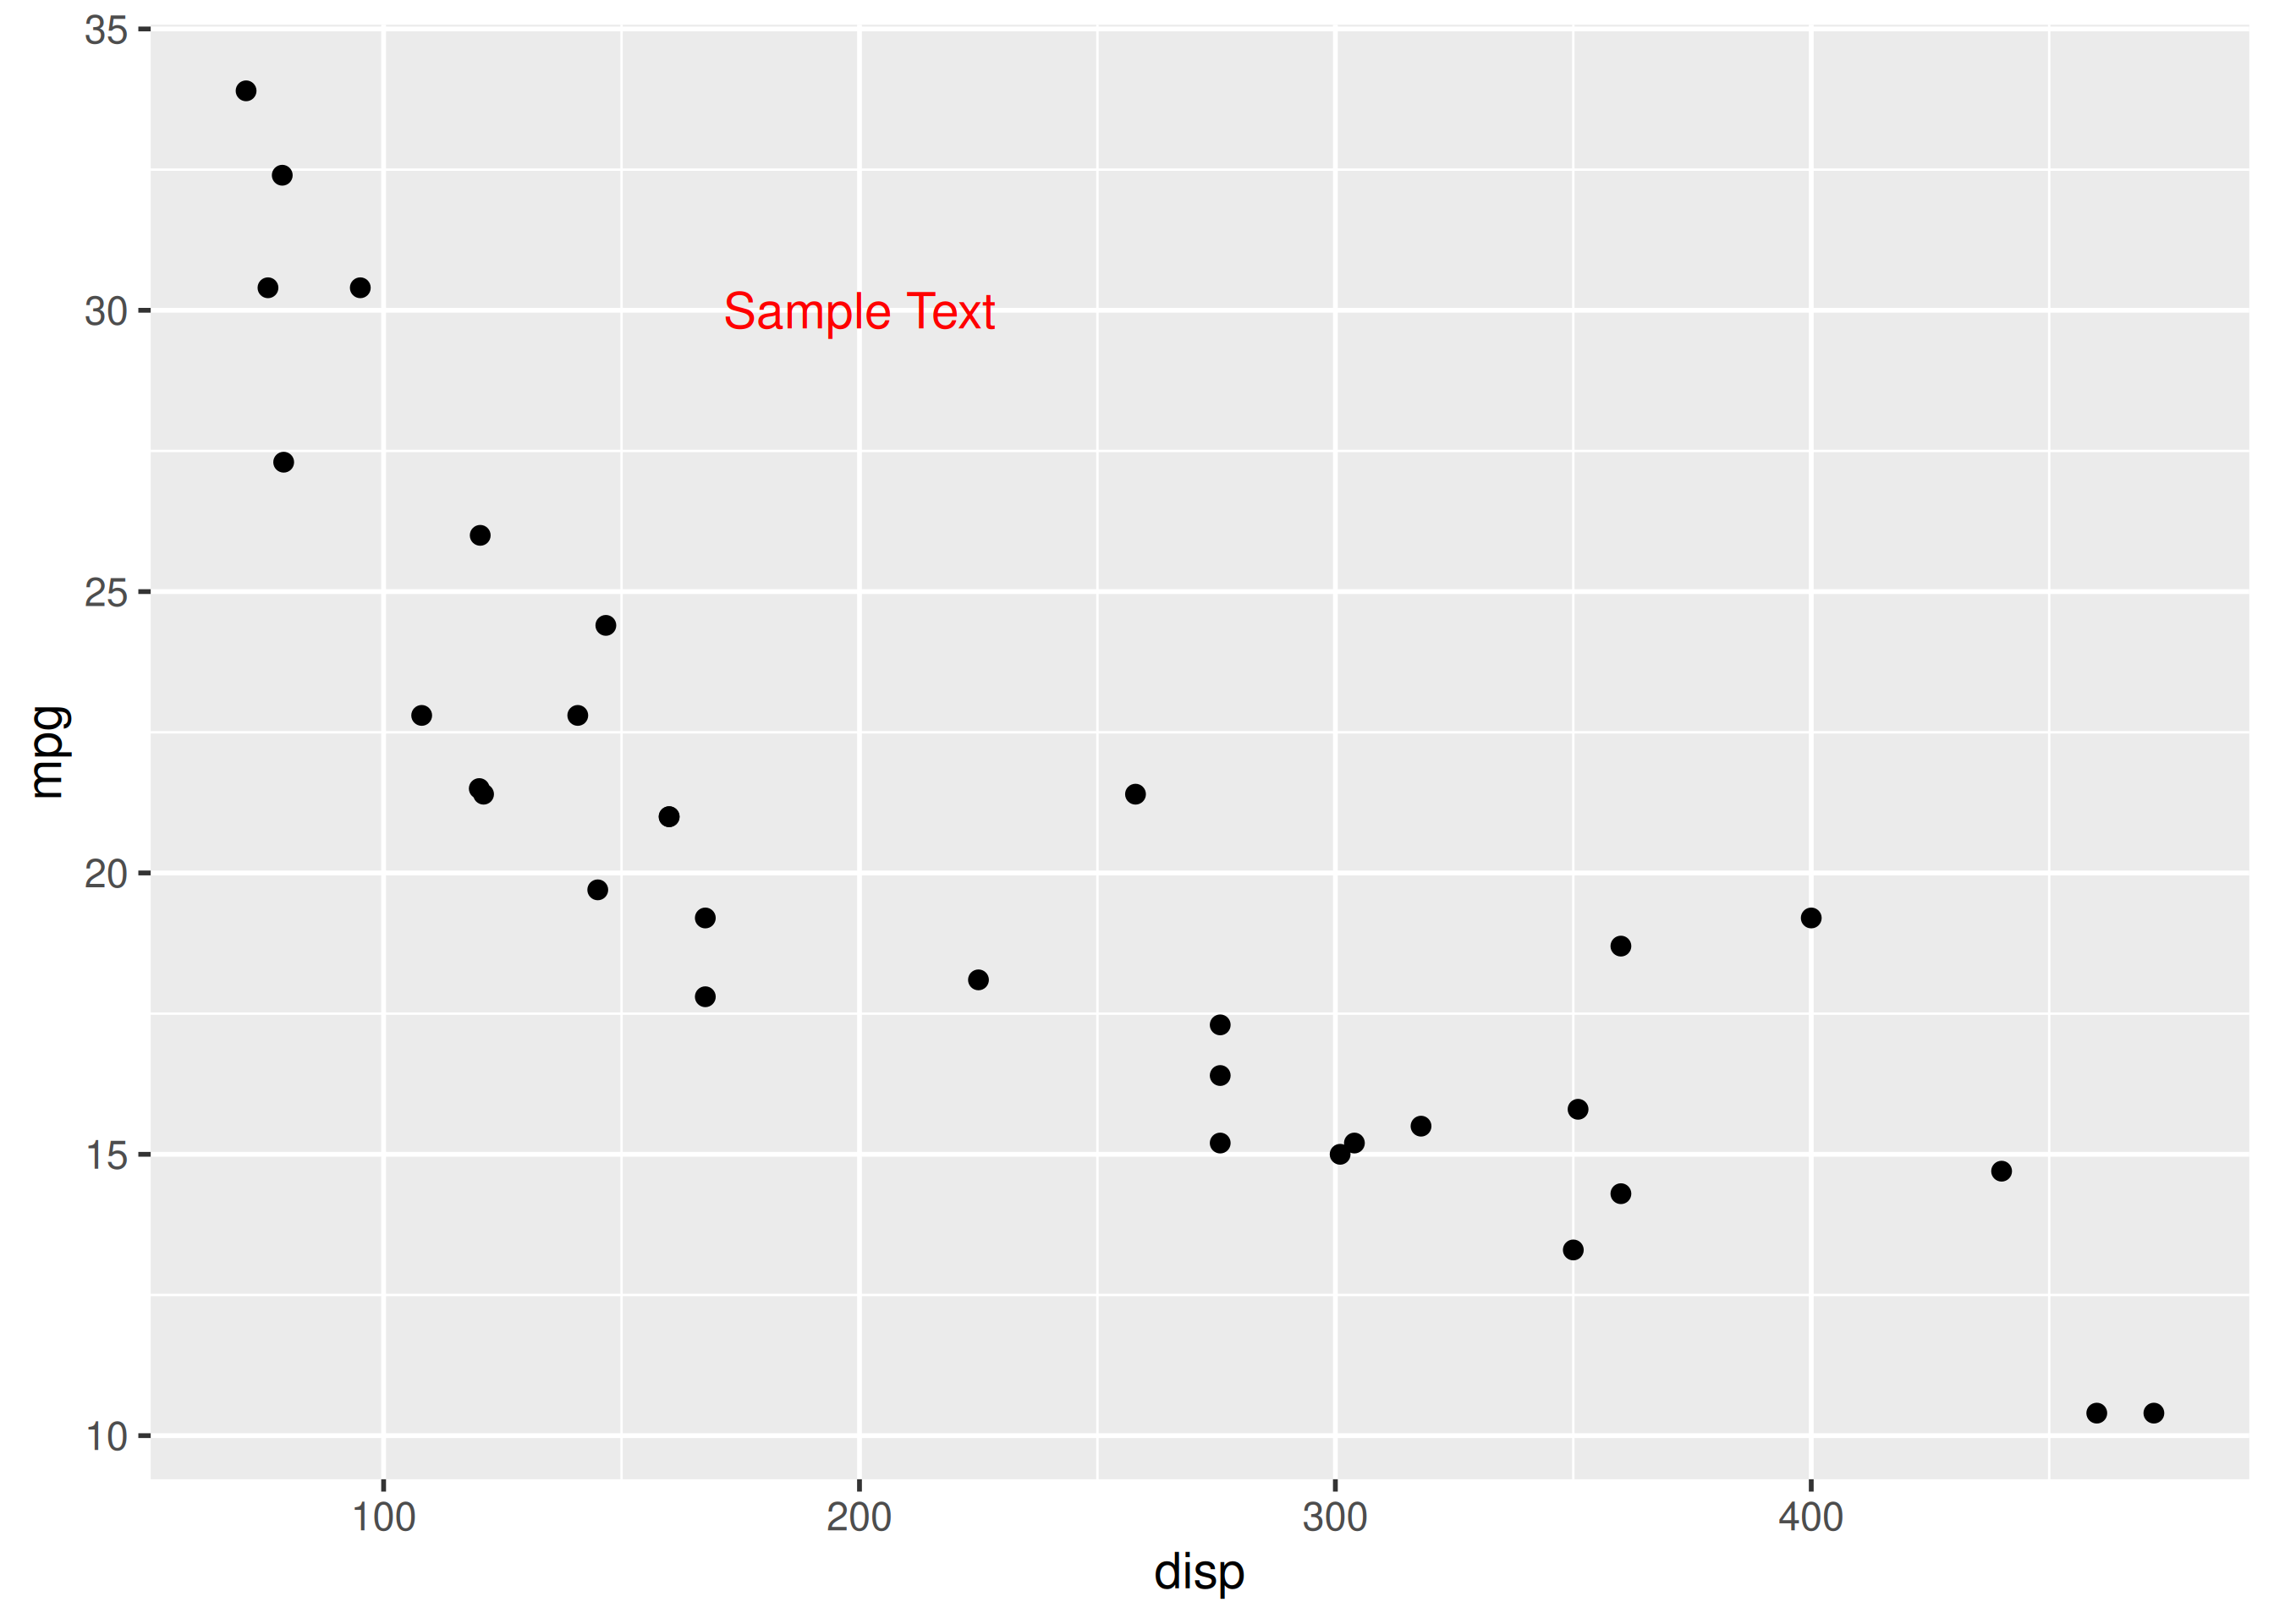
The size argument can be used to modify the size of the text.
ggplot(mtcars) +
  geom_point(aes(disp, mpg)) +
  annotate('text', x = 200, y = 30, label = 'Sample Text', size = 6)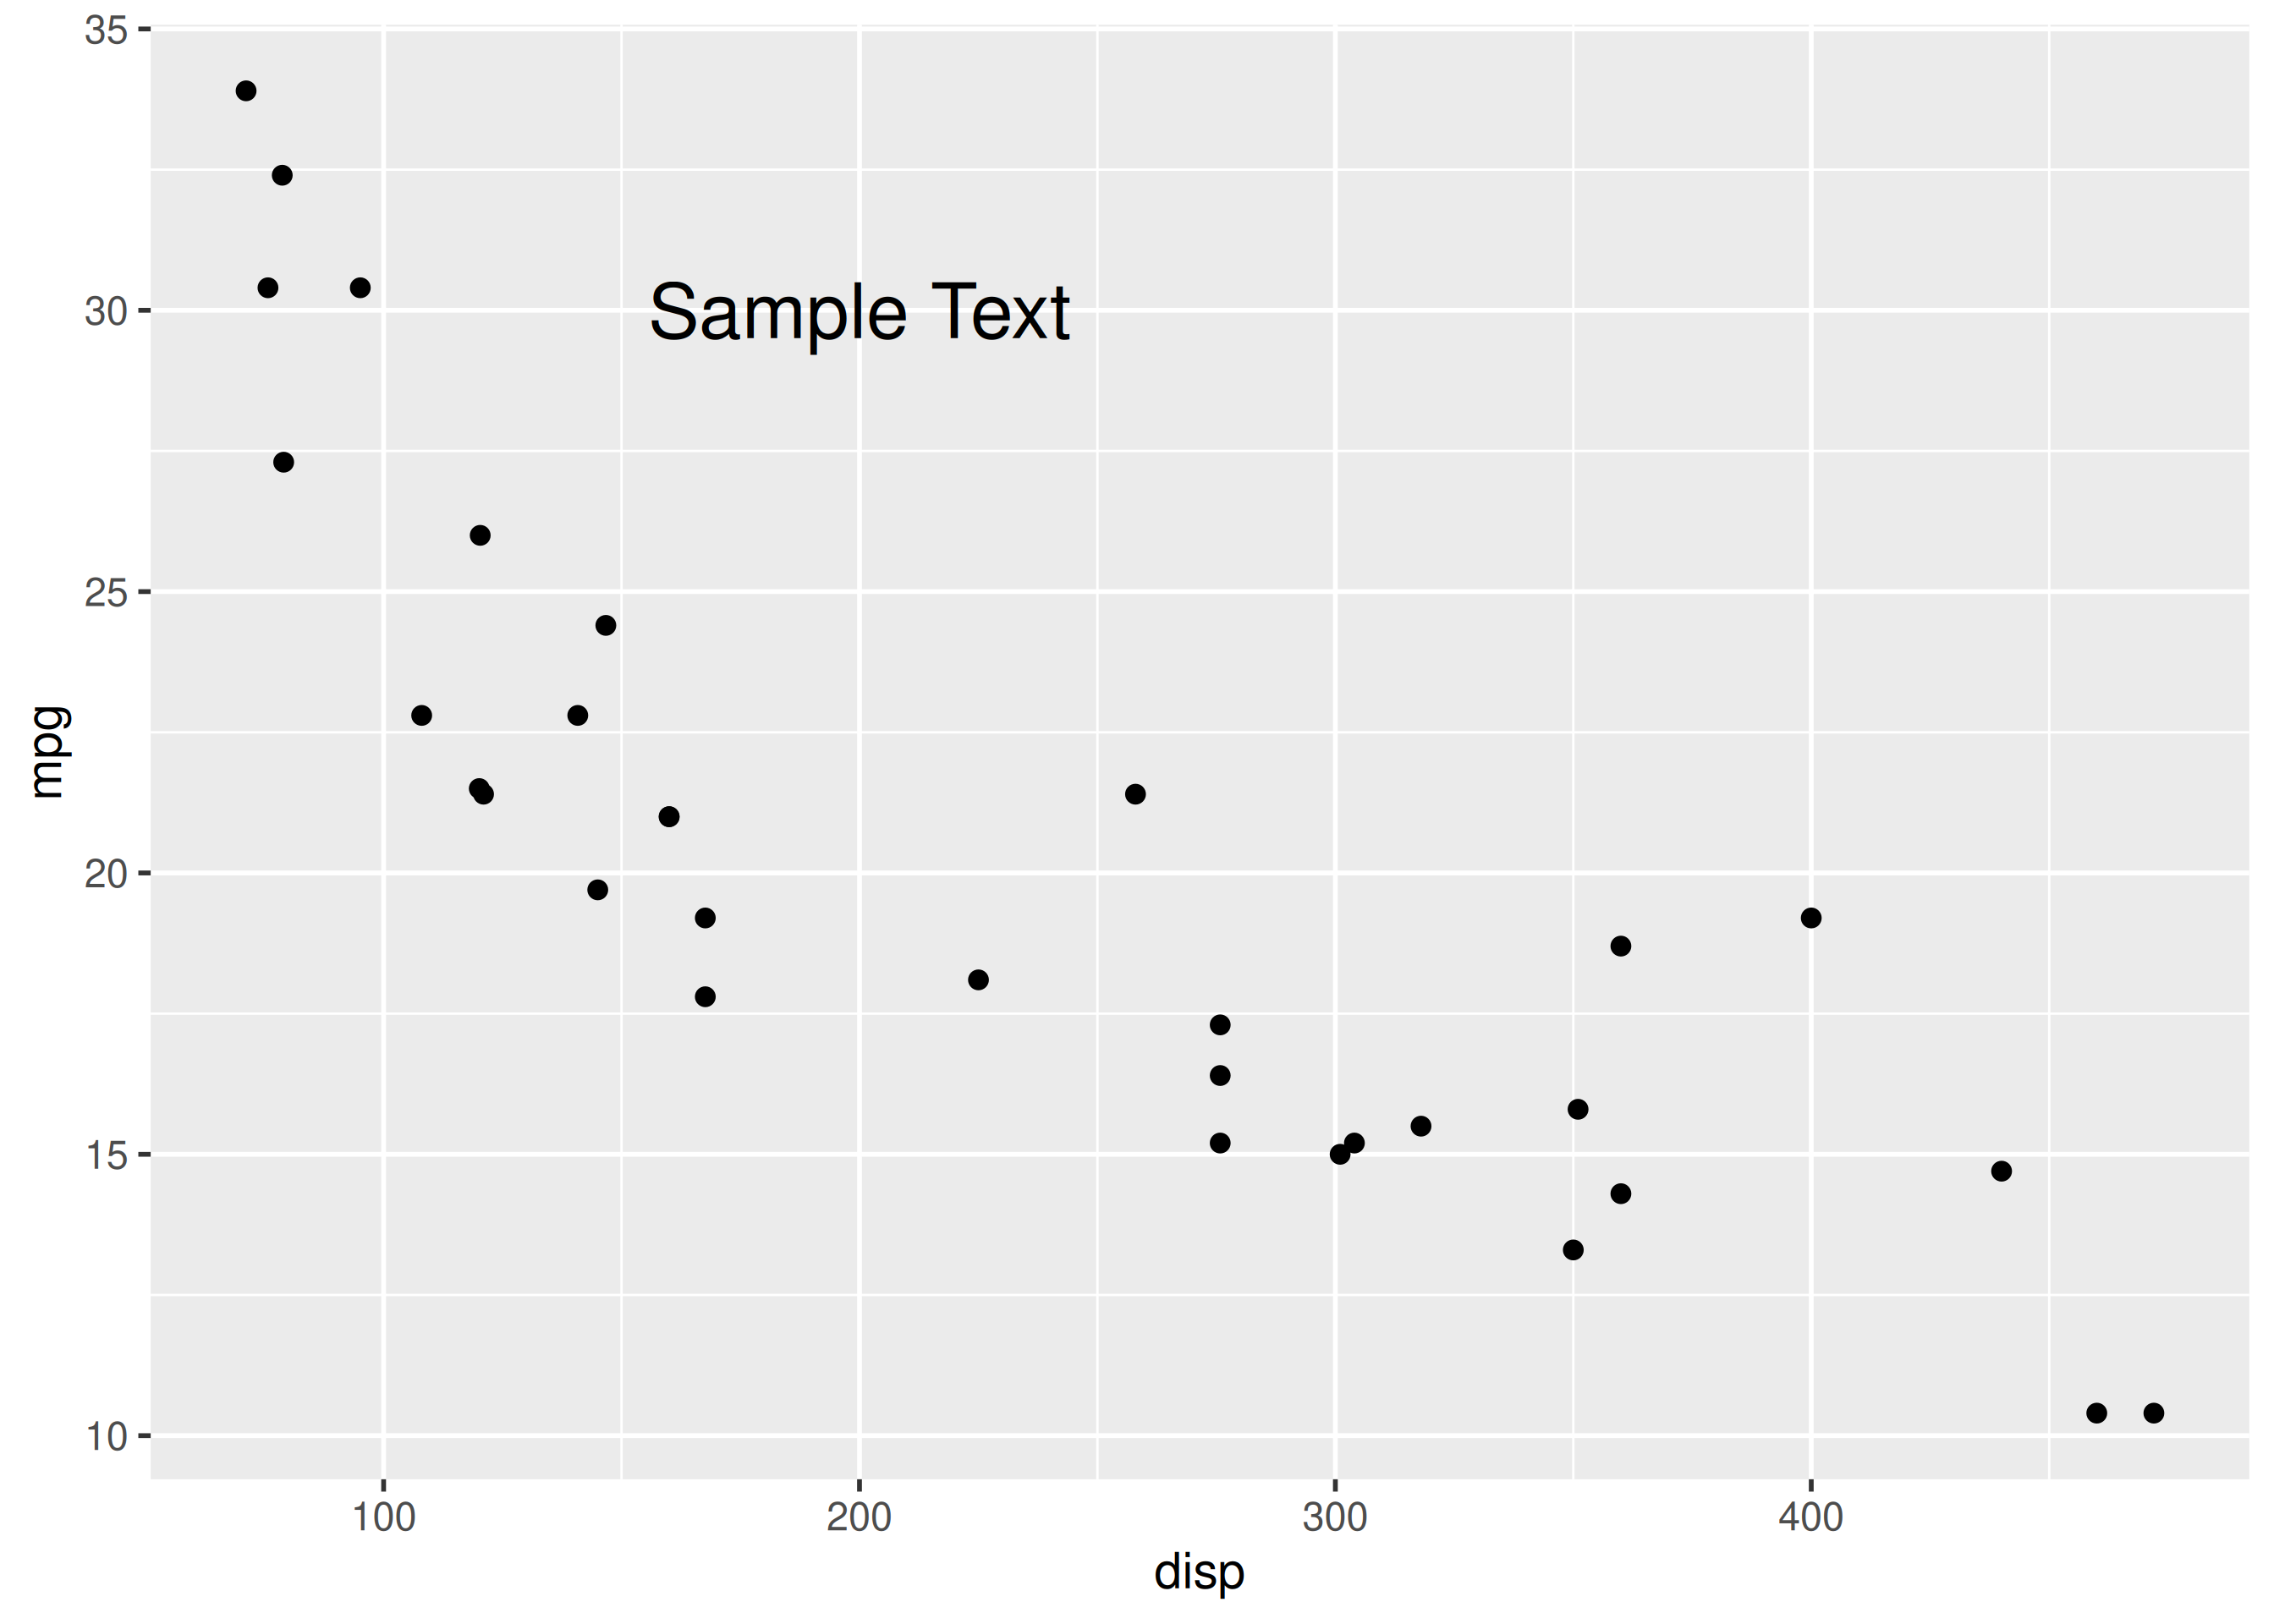
To choose a font of your liking, use the font argument and supply it a valid value.
ggplot(mtcars) +
  geom_point(aes(disp, mpg)) +
  annotate('text', x = 200, y = 30, label = 'Sample Text', fontface = 'bold')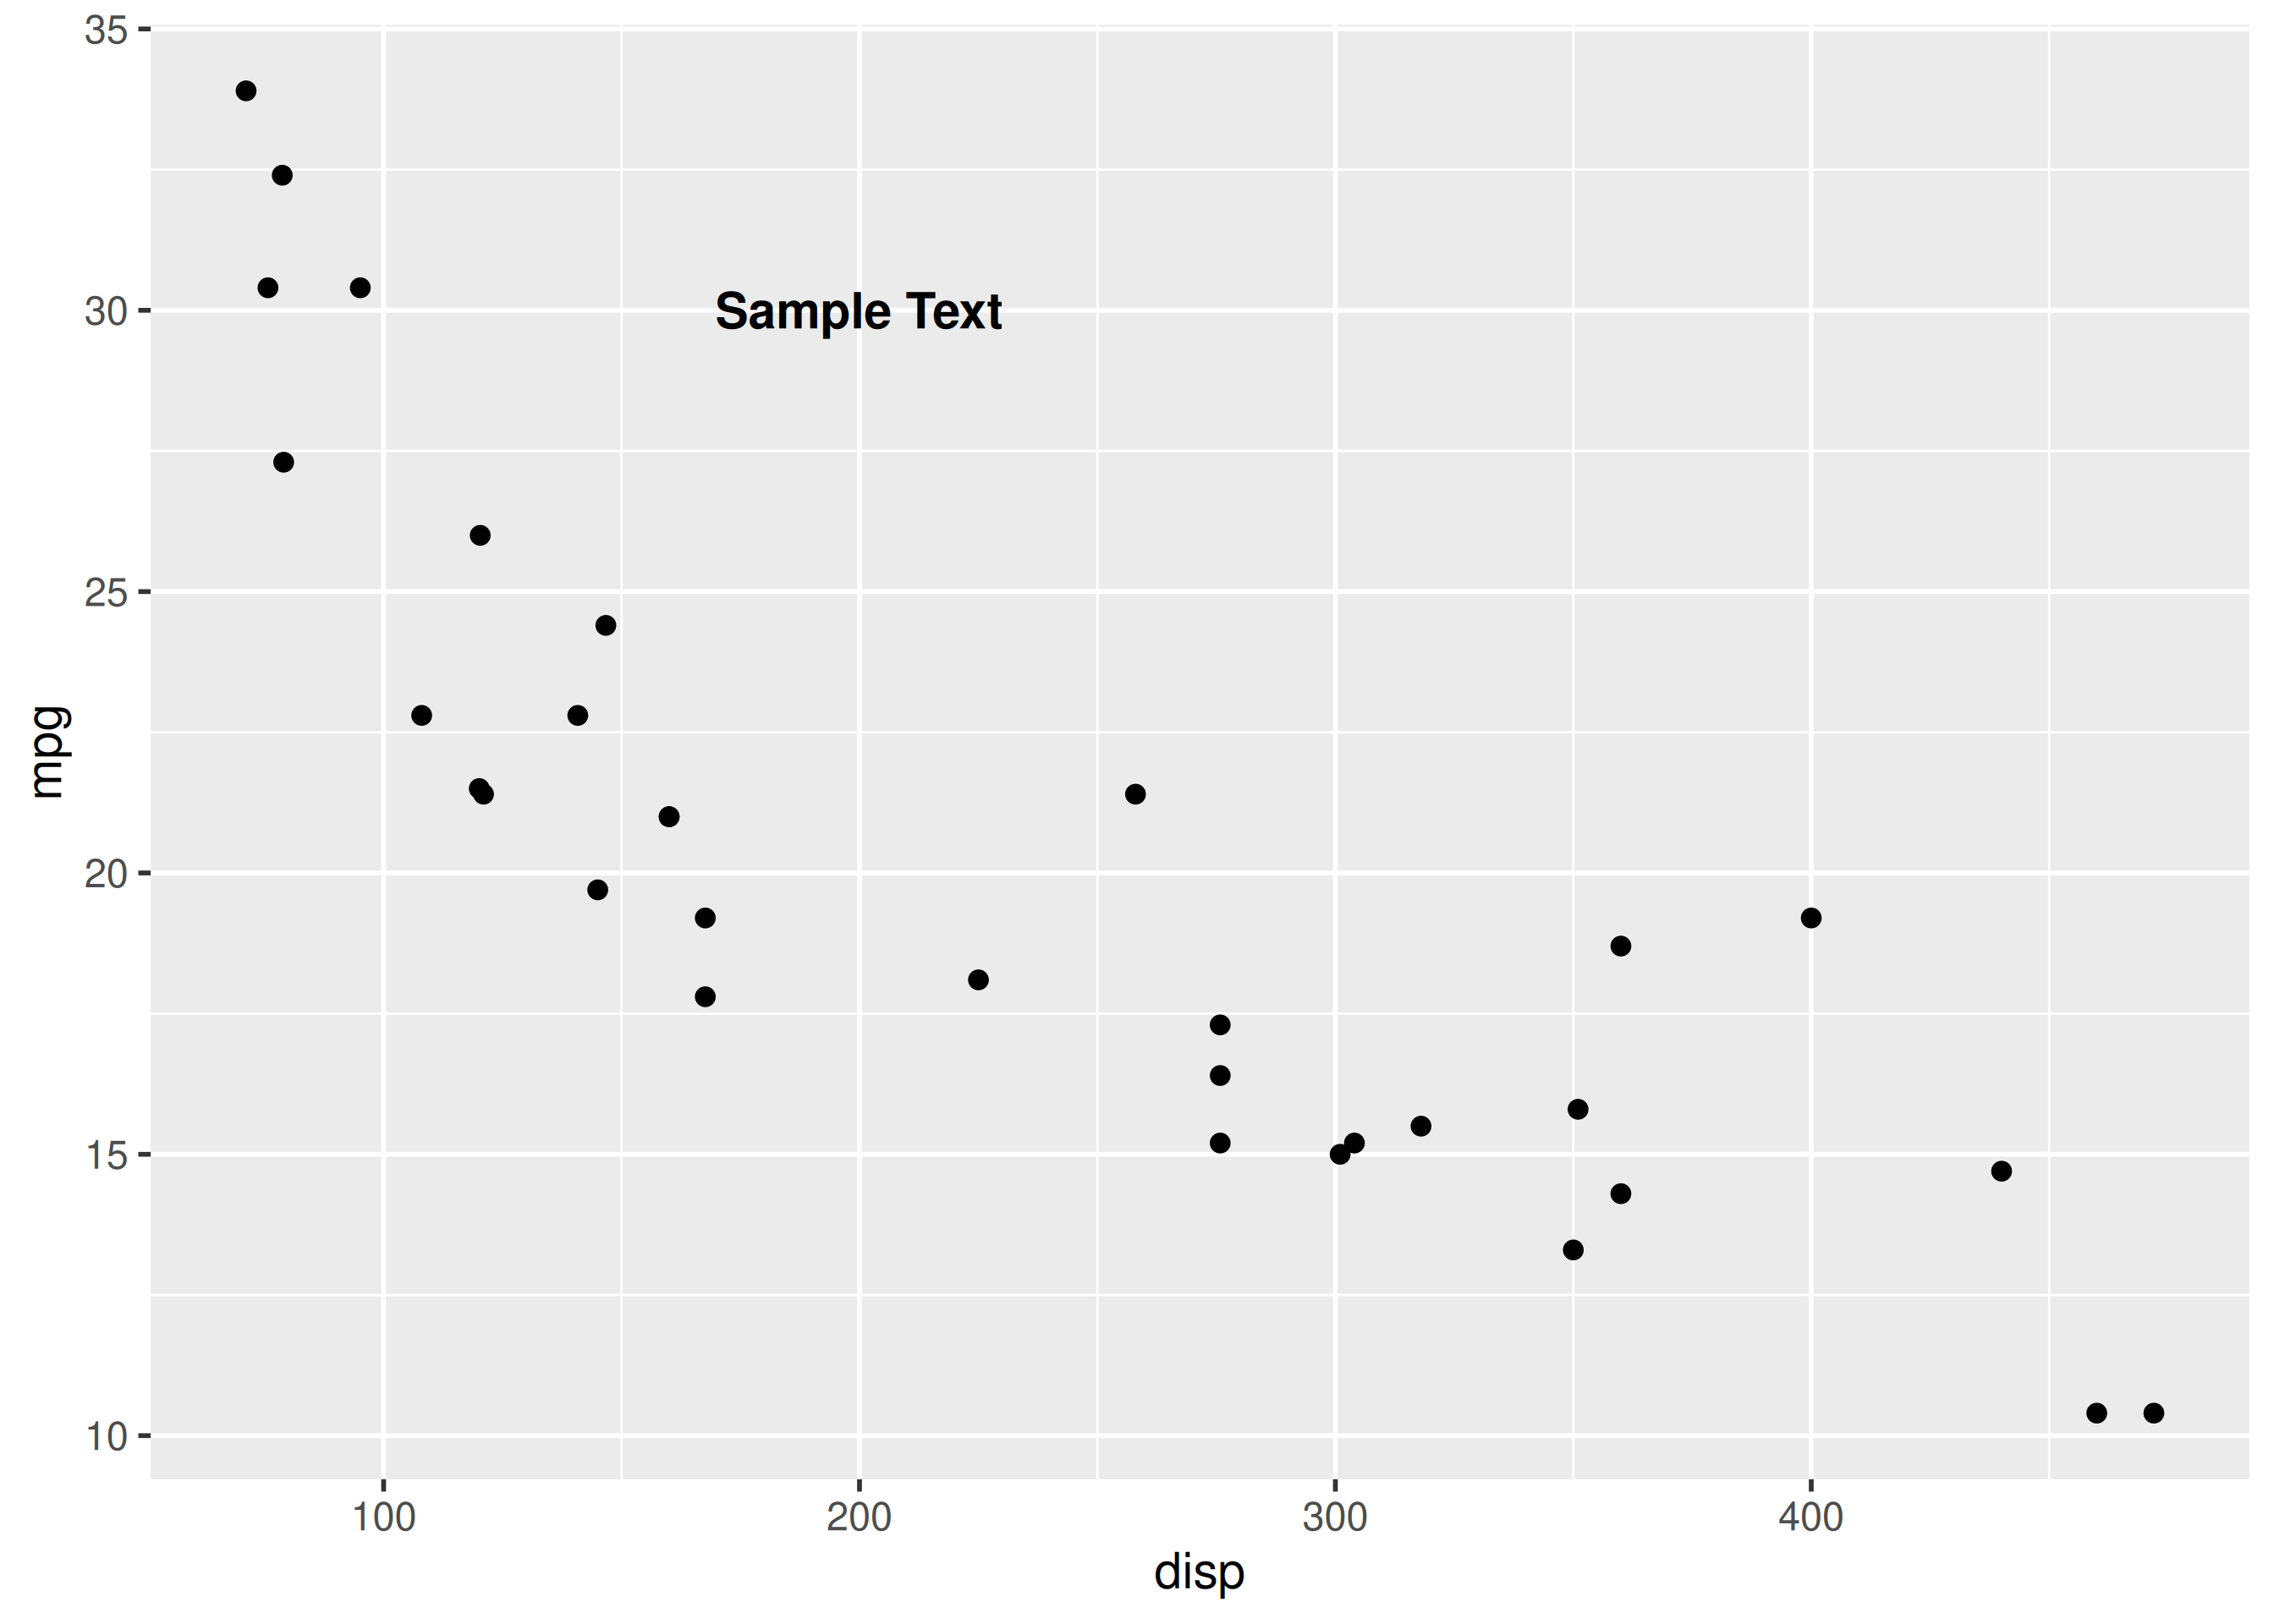
The angle of the text can also be modified using the angle argument. In the below example, we modify the angle of the text to 25.
ggplot(mtcars) +
  geom_point(aes(disp, mpg)) +
  annotate('text', x = 200, y = 30, label = 'Sample Text', angle = 25)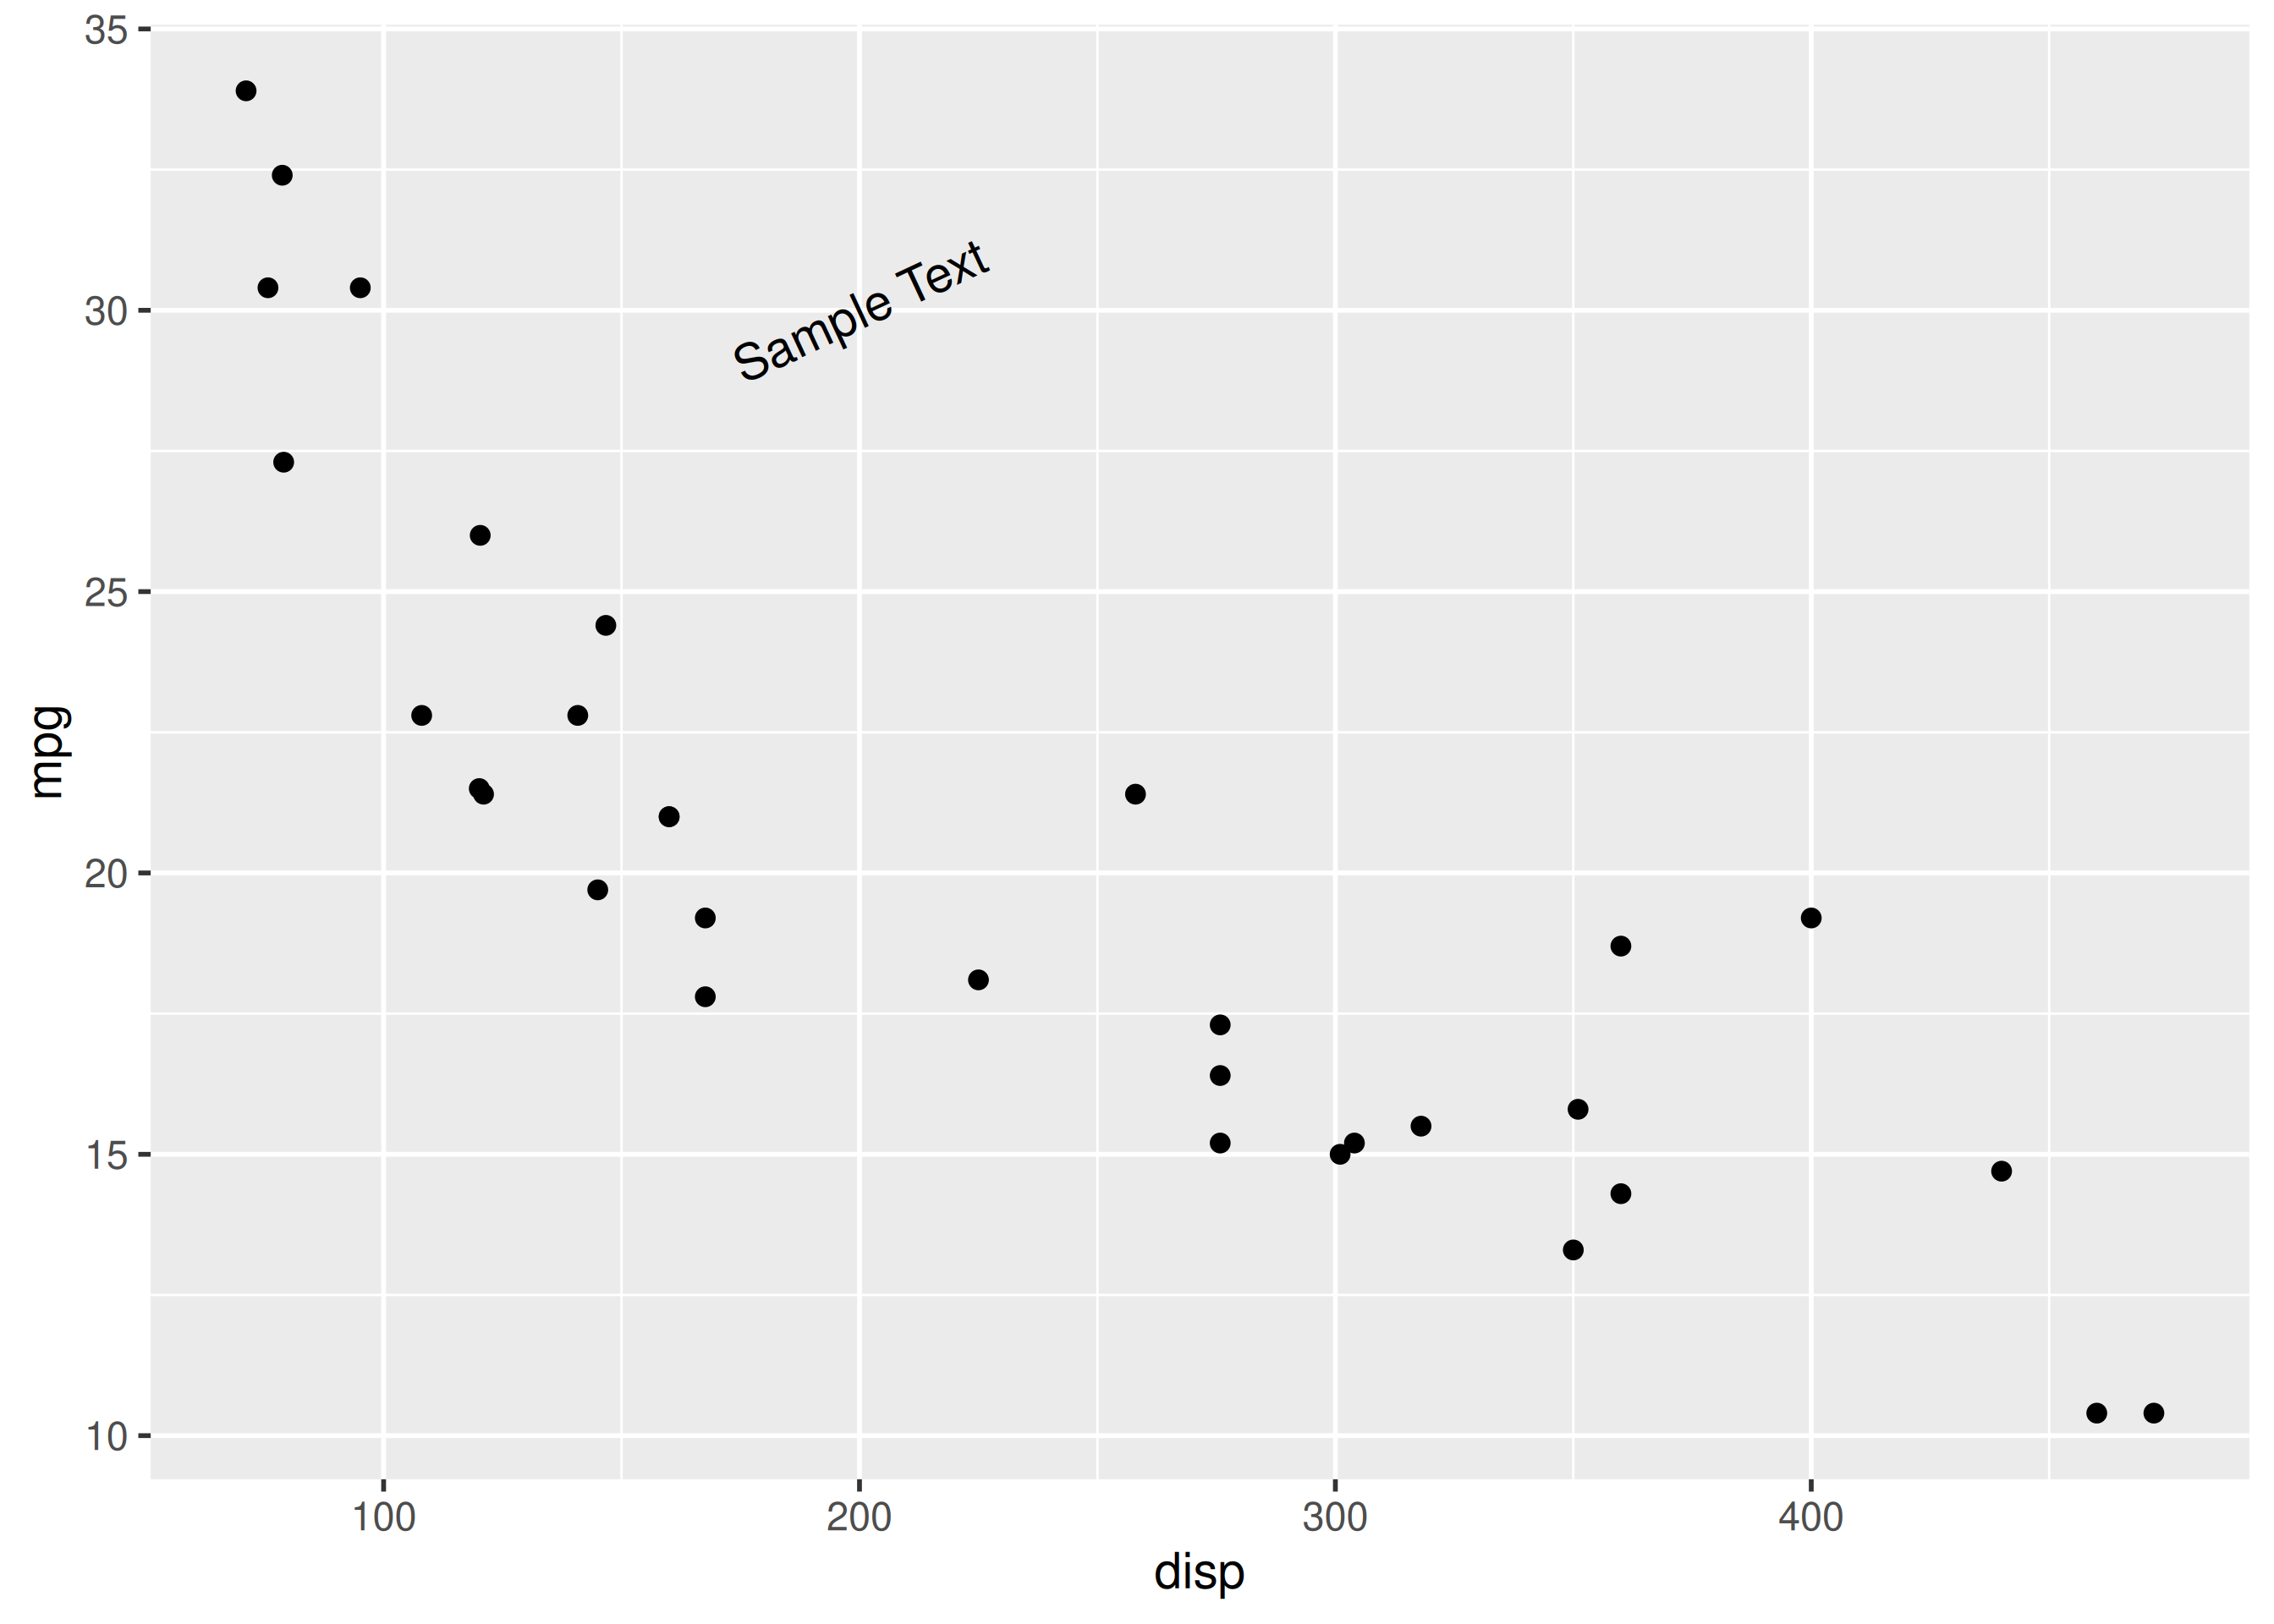
ggplot(mtcars) +
  geom_point(aes(disp, mpg)) +
  annotate('text', x = 200, y = 30, label = 'Sample Text',
           color = 'red', size = 6, fontface = 'bold', angle = 25)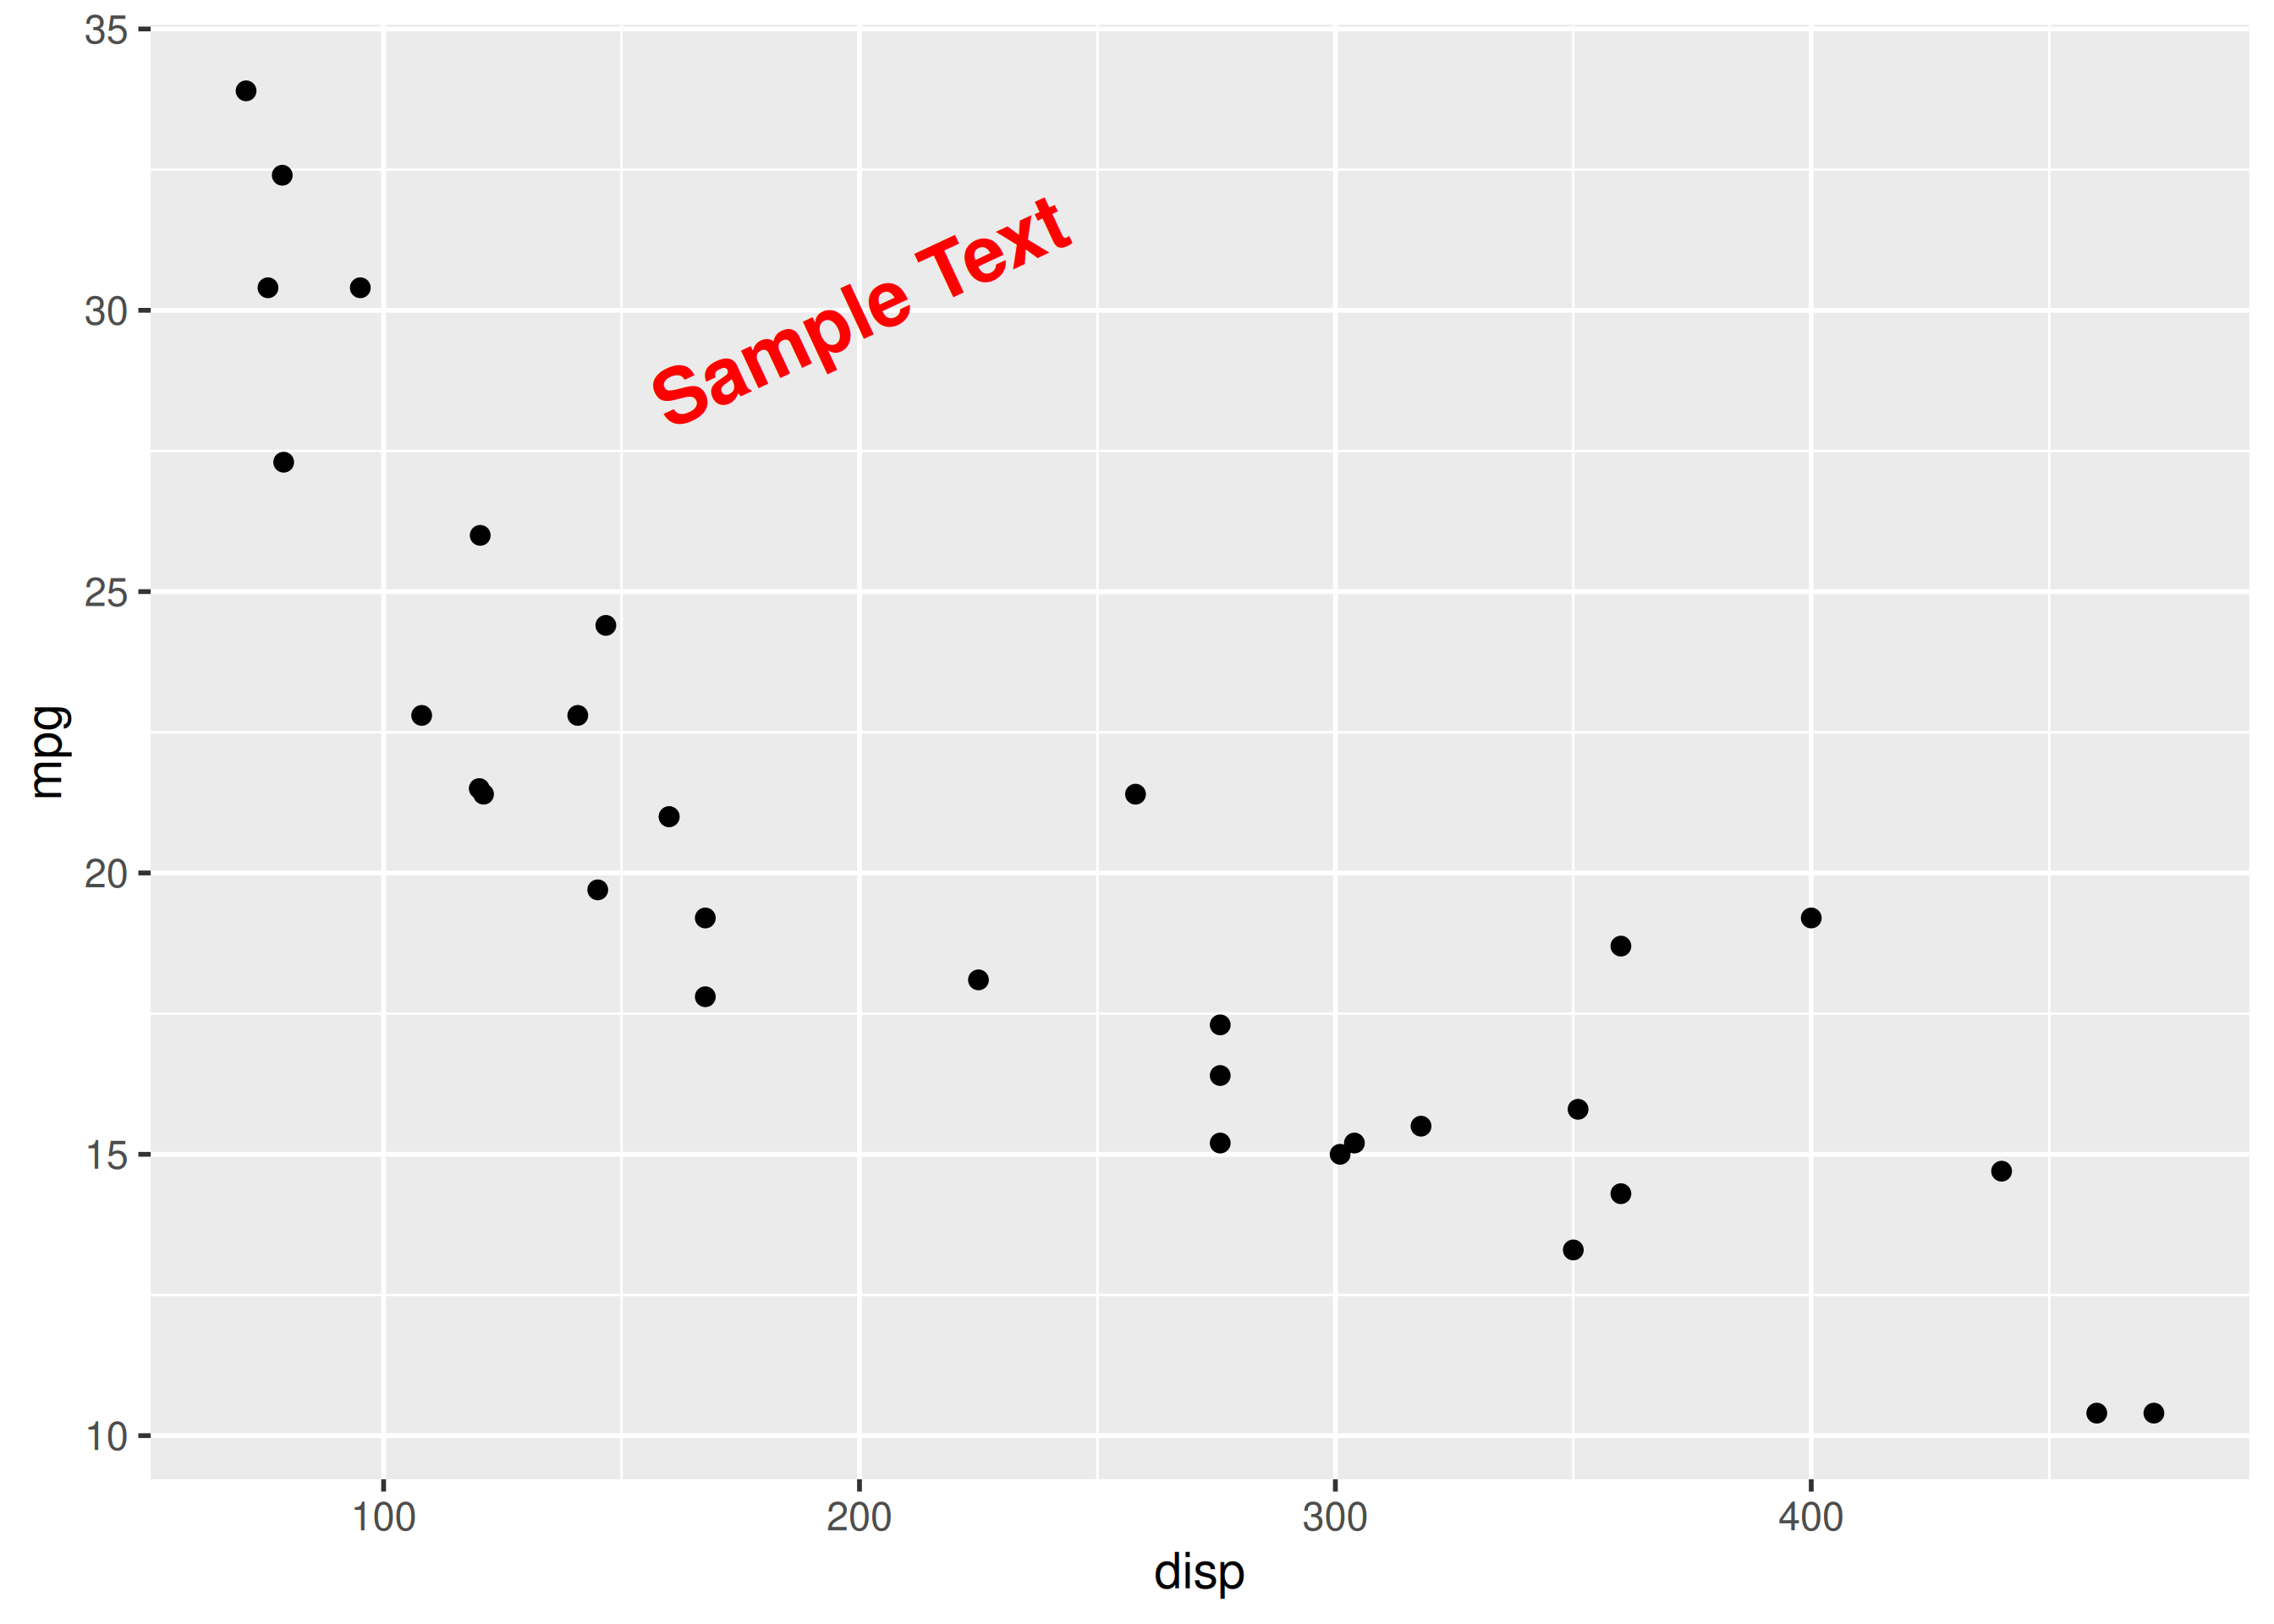
annotate("text", ...).mpg > 30 using geom_text().Worked solutions in solutions/annotations.md (attempt first).